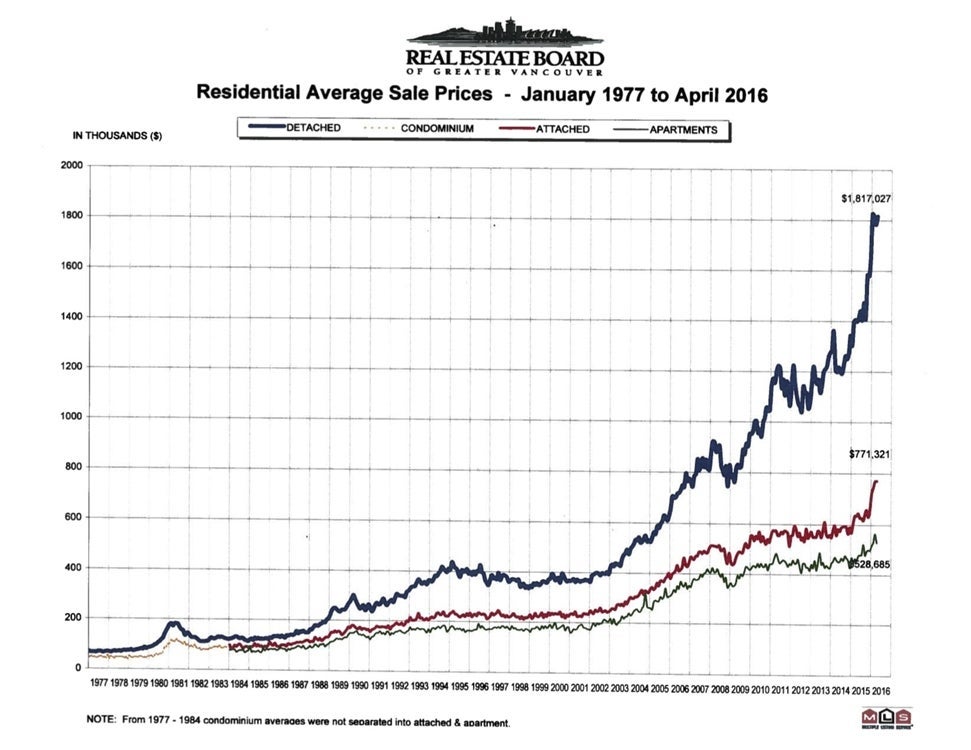
Real Estate Board of Greater Vancouver reports that April was the highest selling on record. The home buyer competition remains intense! Although the listing count is up & the supply still seems to be chasing this surge of demand, therefore prices still seem to be creeping up.

North Vancouver Stats:
Detached Homes Benchmark Price $1,487,600
1yr change up 30.6%
3yr change up 58%
5yr change up 65.5%
Townhouse Benchmark Price $753,300
1yr change up 20.5%
3 yr change up 28.9%
5 yr change up 31.2%
Apartment Benchmark Price $417,900
1yr change up 12.4%
3yr change up 20.9%
5 yr change up15.5%
West Vancouver Stats
Detached Homes Benchmark Price $2,928,200
1yr change up 31.6%
3yr change up 59.3%
5yr change up 75.0%
Apartment Benchmark Price $854,100
1yr change up 36.5%
3yr change up 44.0%
5 yr change up 33.2%
- New listings for detached, attached and apartments have increased 3.9% over April 2015
- The total number of properties listed for sale is down 38.3% compared to April 2015
- Sales - active listings ratio is at 63.3% (home prices experience upward pressure when the ratio reaches the 20%-22% in a particular community for a sustained period of time.

North Vancouver Stats:
Detached Homes Benchmark Price $1,487,600
1yr change up 30.6%
3yr change up 58%
5yr change up 65.5%
Townhouse Benchmark Price $753,300
1yr change up 20.5%
3 yr change up 28.9%
5 yr change up 31.2%
Apartment Benchmark Price $417,900
1yr change up 12.4%
3yr change up 20.9%
5 yr change up15.5%
West Vancouver Stats
Detached Homes Benchmark Price $2,928,200
1yr change up 31.6%
3yr change up 59.3%
5yr change up 75.0%
Apartment Benchmark Price $854,100
1yr change up 36.5%
3yr change up 44.0%
5 yr change up 33.2%